| Run summary data | |
| Master run log | log_20160610120334.txt |
| BIOM table statistics | biom_table_summary.txt |
| Filtered BIOM table (minimum sequence count: 859) | table_mc859.biom.gz |
| rarefied BIOM table (sampling depth: 859) | table_even859.biom.gz |
| Raw read count table | TEXT CSV(Excel) |
| Raw read count tables by taxon levels | TEXT (tab-delimited) |
| Taxonomic summary results | |
| Taxa summary bar plots | bar_charts.html |
| Taxa summary area plots | area_charts.html |
| Taxa summary pie charts | pie_charts.html |
| Alpha diversity results | |
| Alpha rarefaction plots (multiple matrices available) | rarefaction_plots.html |
| Beta diversity results (even sampling: 859) | |
| PCoA 2D plots | |
| PCoA 3D plots | |
| Distance matrices | |
| Principal coordinate matrices | |
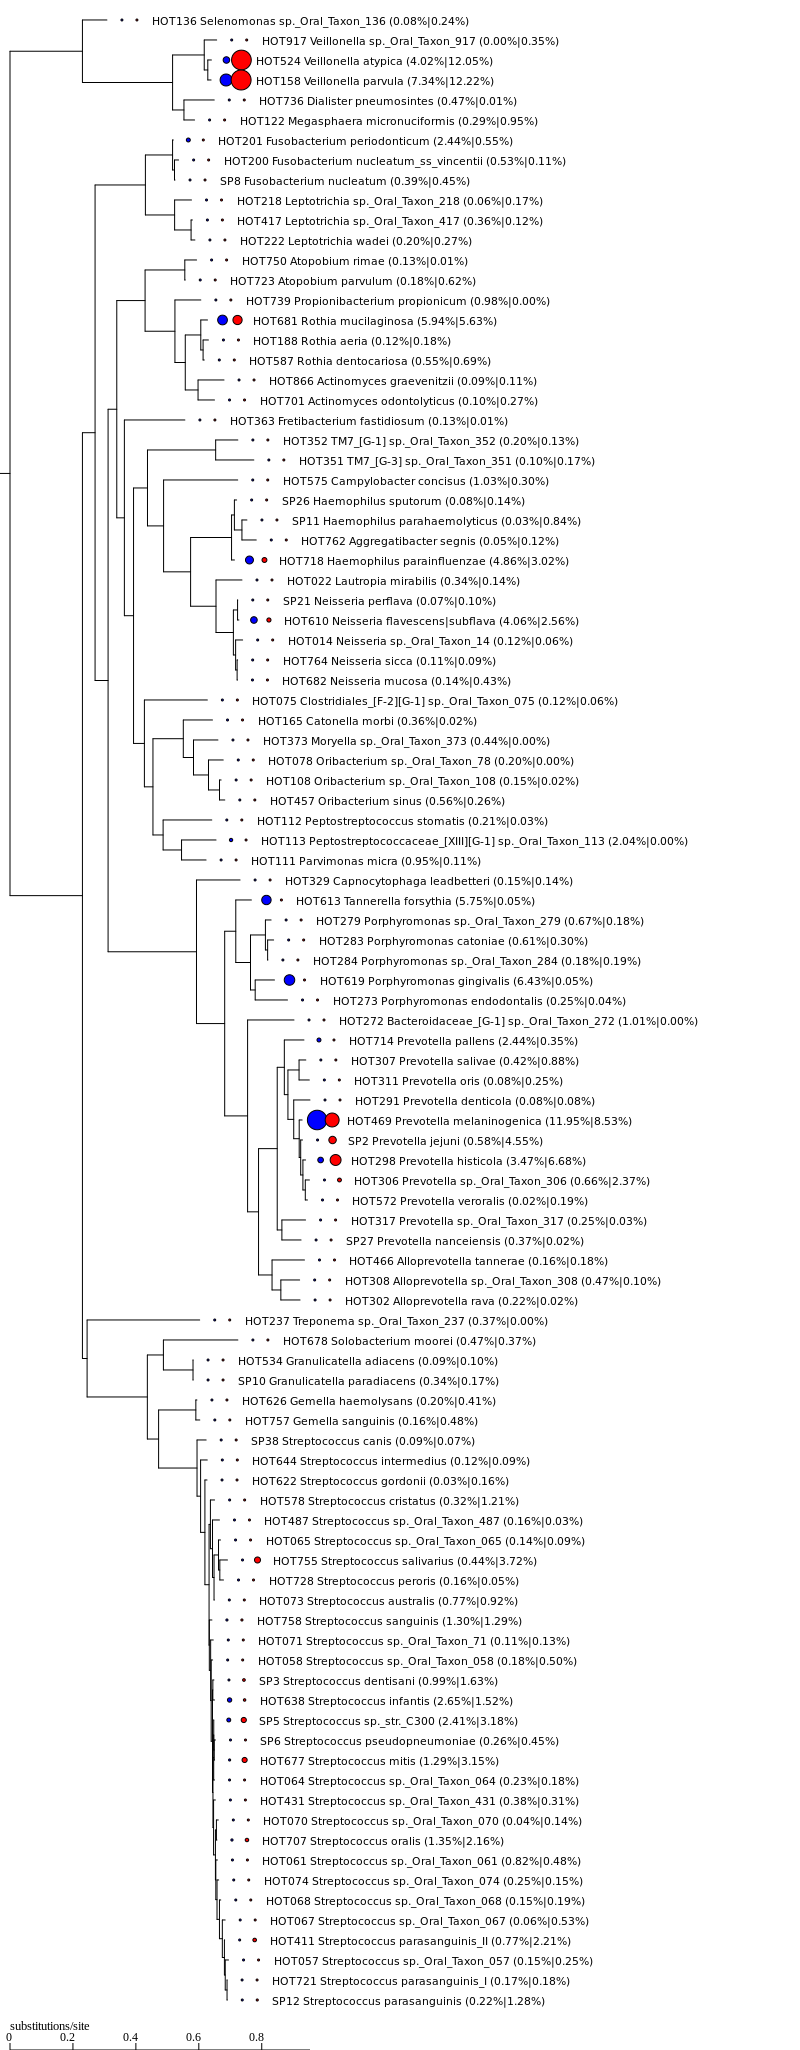
| Percent Read Abundance Plot on Phylogenetic Tree | |
| Scalable Vector Graphics (SVG) Format |
| Portable Network Graphics (PNG) Format |
| Portable Document Format (PDF) Format |
